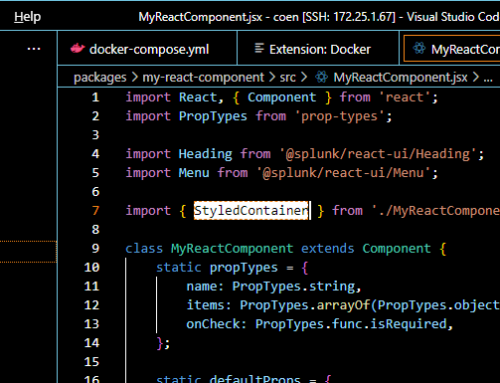
Diagnostics is a product that helps in monitoring the usage and performance of Smallworld GIS applications. I have created a plugin in Smallworld that queries Splunk from Magik using REST API to display the diagnostics data directly in Smallworld, which can be viewed in real time.
Diagnostics, by virtue of being a monitoring tool for the Smallworld application, is of immense significance to its effective functioning and maintenance. It helps in stepping up the performance of a Smallworld application and also ensures a better user experience.
Diagnostics Control
Diagnostics control is a new plugin that ensures a seamless user-friendly experience in being able to access data of the Diagnostics application directly in the Smallworld application itself, without having to visit the Diagnostics dashboards, every time one has to monitor the usage in Smallworld.
One stop solution
For static users
I have created a plugin to help static users get their specific predetermined queries answered in the Smallworld application. For example, it can only be used to get the design changes of other users in same area.
For Dynamic users
A separate search box can be created to enable the dynamic users have their Diagnostics queries (you can type Diagnostics queries directly into the search box, as is indicated below) answered in the Smallworld application itself.
Close Monitoring
Availability of access to the Diagnostics data in the Smallworld application itself enables real time monitoring of the performance of Smallworld, which in turn helps in improving the overall Smallworld experience.
For Splunk users
Users of Splunk have the option of creating their own search box in the Smallworld application itself. They may hence, have their queries directed to the Diagnostics application answered in the Smallworld application itself. It helps to avoid repeated visits to the Diagnostics application.
What does it do?
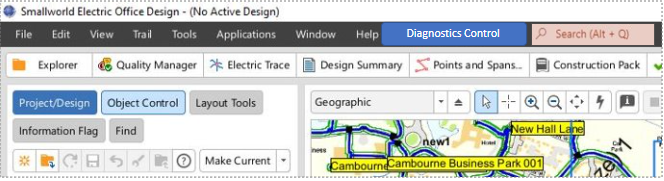
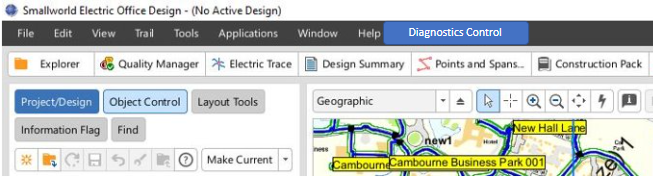
In the Smallworld application menu bar, I have created an additional plugin which goes by the name Diagnostics Control. This new feature enables an easy interface with the Diagnostics data.
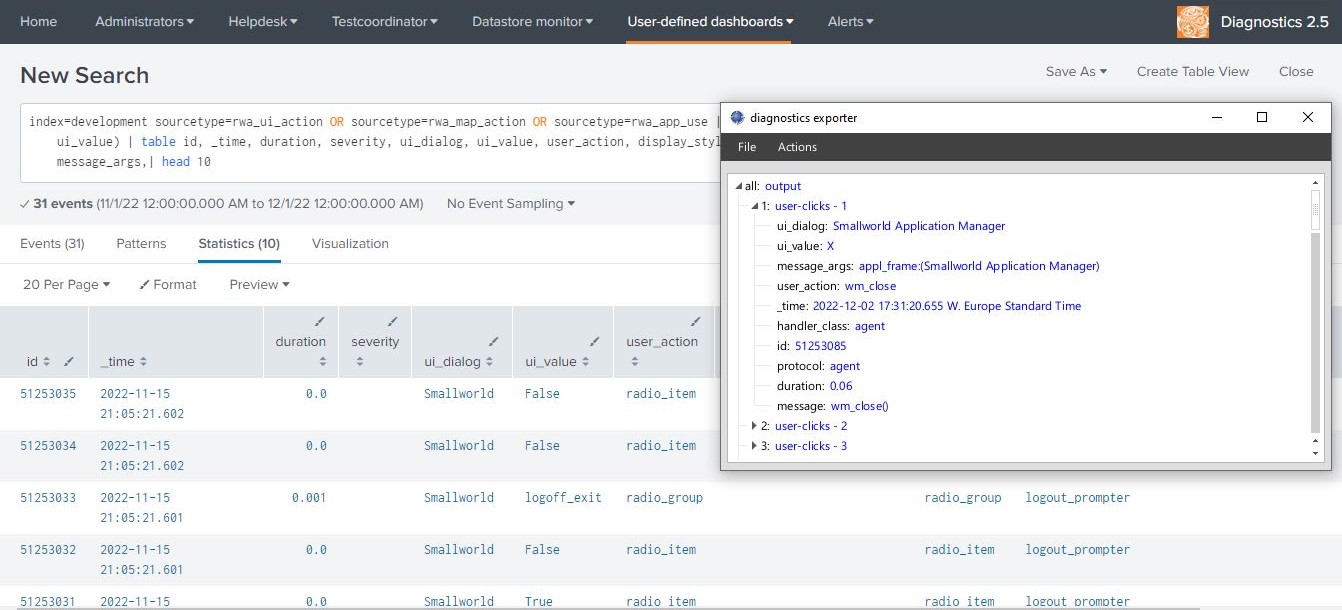
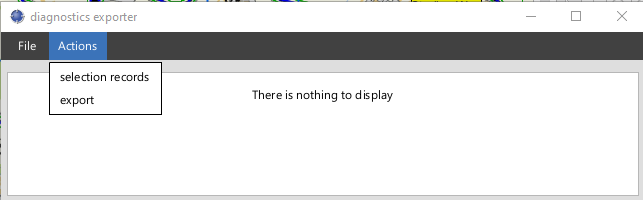
Selection of the diagnostics control plugin takes us to the diagnostics exporter dialog box. On selecting the option Actions, it opens a dropdown as indicated below:
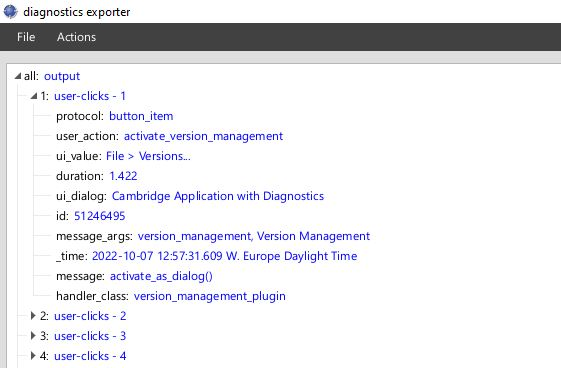
The option “Selection Records” would help us get the required output in json. I have shown it in tree format, as is indicated below. You may get the output displayed in any format like Table, Events etc. as per your requirement.
This new feature that I have created in the Smallworld application ensures greater access to the data of the Diagnostics application. It enables easy navigability between Smallworld and Diagnostics. It thus ensures optimum usage and easy access of the Diagnostics tool in real time, without having to ever exit the Smallworld application in pursuit of doing so.